
The Apache httpd web server comes with a benchmarking tool to simulate a high load and to gather data for analysis.
ab -n 1000 -c 10 -g test_data_1.txt http://www.your-domain.com/index.html
| Option | Description |
|---|---|
| -n | number of requests. Default is 1 which is useless. |
| -c | concurrent requests. Default 1 |
| -g | GNU plot output. Labels are on first line of output. |
| -q | Suppress progress stattus output to stderr. |
| -t | Time limit. Maximum number of seconds. |
| -A username:password | Specify authentication credentials. |
| -X proxy[:port] | Specify a proxy server. |
See the ab man page for a list and description of all options.
This will generate the output data file test_data_1.txt.
starttime       seconds ctime   dtime   ttime   wait
Sun Sep 20 00:15:54 2009        1253430954893362        16      808     824 47
Sun Sep 20 00:15:54 2009        1253430954893262        14      957     971 60
Sun Sep 20 00:15:54 2009        1253430954893147        9       1002    1011 62
...
...
..
..
Console output:
Finished 1000 requests


Server Software:        Apache/2.2.3
Server Hostname:        www.your-domain.com
Server Port:            80

Document Path:          /index.html
Document Length:        83241 bytes

Concurrency Level:      10
Time taken for tests:   14.793312 seconds
Complete requests:      1000
Failed requests:        0
Write errors:           0
Total transferred:      83608000 bytes
HTML transferred:       83241000 bytes
Requests per second:    67.60 [#/sec] (mean)
Time per request:       147.933 [ms] (mean)
Time per request:       14.793 [ms] (mean, across all concurrent requests)
Transfer rate:          5519.25 [Kbytes/sec] received

Connection Times (ms)
              min  mean[+/-sd] median   max
Connect:        0   20 250.2      0    3000
Processing:    53  126  52.7    120     317
Waiting:       19   51  29.5     46     246
Total:         53  147 260.2    120    3305

Percentage of the requests served within a certain time (ms)
  50%    120
  66%    142
  75%    159
  80%    172
  90%    198
  95%    227
  98%    282
  99%    314
 100%   3305 (longest request)
This shows the load limit of the server.
Interactive session:
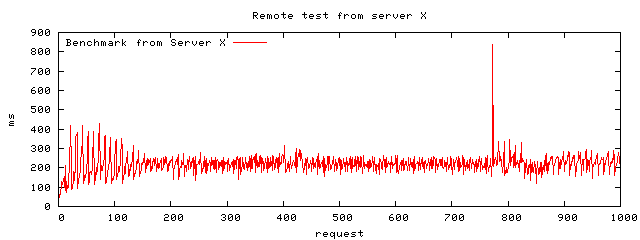
$ gnuplot
gnuplot> set terminal png
gnuplot> set output "ApacheBenchmarkResults.png"
gnuplot> set title "Benchmark from Server X"
gnuplot> set size 1,0.5
gnuplot> set key left top
gnuplot> set xlabel 'request'
gnuplot> set ylabel 'ms'
gnuplot> plot "test_data_1.txt" using 10 with lines title 'Benchmark from Server X'
gnuplot> exit
or as a script:
#!/usr/bin/gnuplot
# Script to plot web server load
set terminal png
set output "ApacheBenchmarkResults.png"
set title "Benchmark from Server X"
set size 1,0.5
set key left top
set xlabel 'request'
set ylabel 'ms'
plot "test_data_1.txt" using 10 with lines title 'Benchmark from Server X'
Web performance benchmarking tool httperf. Httperf sends requests to the web server at a specified rate and gathers stats. Increase till one finds the saturation point.
Installation:- Debian: apt-get install httperf
- Print performance stats for home page of your-domain.com: httperf --hog --server www.your-domain.com
- Create 100 connections at a rate of 10/sec: httperf --hog --server http://www.your-domain.com/ --num-conn 100 --rate 10 --timeout 5
- Generate 10 sessions at a rate of one session/sec every 2 seconds: httperf --hog --ser=www --wsess=10,5,2 --rate 1 --timeout 5
httperf command line options:
| Command | Command Description |
|---|---|
| --hog | Use as many TCP ports as necessary to generate stats (else limited to port 1024-5000) |
| --num-calls | Session oriented workloads. |
| --max-connections=# | Limit the number of connections to that specified. |
| --num-calls=# | Specify the number of calls to issue on each connection before closing it. |
| --server host-name | Default localhost. Specify IP address of host name. |
| --wsess=N1,N2,X | Specify session where N1: number of sessions N2: number of calls per session X: delay between calls (sec) |
| --timeout | Stop if there is no response within timeout period. |
Links:
- httperf home page - downloads, documentation
 Books:
 |
"Apache Server Bible 2"
by Mohammed J. Kabir ISBN # 0764548212, Hungry Minds This book is very complete covering all aspects in detail. It is not your basic reprint of the apache.org documents like so many others. |

|
 |
"How to Break Web Software: Functional and Security Testing of Web Applications and Web Services."
by Mike Andrews and James Whittaker ISBN # 0321369440 Addison-Wesley Professional (February 12, 2006) Guide to rigorous testing. |
|