
Jenkins can monitor your CM system to detect a check-in of C++ source code. Upon recognition of this change, Jenkins will update a local working directory of code and perform a series of build steps (e.g. "ant clean", "ant compile"). See our Jenkins installation and configuration tutorial.
This tutorial will cover the installation, configuration and use of tools, Jenkins plug-ins and their configuration to support the unique tools used for C++ software development. There are a plethora of C++ tools to auto-generate documents, perform unit tests, code reviews and execution code coverage. We will cover the most prominent tool for each and their integration with Jenkins Continuous Integration (CI). All builds in this tutorial will be driven by Apache Ant
Other related YoLinux.com Tutorials:
DOxygen is a powerful auto-documentation tool for C++. Tagged comments and inferred information are gathered to develop HTML (also RTF, etc) source code documentation. When used in conjunction with Graphviz, simple UML class diagrams can be generated for a single class and its' relations.
Also see our YoLinux tutorial on tagging C++ for dOxygen.
The Jenkins dOxygen plugin will allow you to view doxygen documentation through Jenkins. Note that this plugin does not perform the document generation but just allows one to view the results as a link from within Jenkins.
- Install Jenkins dOxygen plugin:
- Jenkins (start page) + "Manage Jenkins" + "Manage Plugins".
- Select the "Available" tab.
- Select plugin "Doxygen" (under the "Build Reports" category) for installation.
- Then select the "Install" button at the bottom of the page.
- Configure Build:
Add dOxygen document generation to your build by adding the ant target "doxygen".
File: build.xml... ... <property name="build.native" value="./"/> <property name="doxygen.cmd" value="/usr/bin/doxygen"/> <target name="clean" description="clean up" > <delete quiet="true"> <fileset dir="Docs/html" includes="**/*" /> </delete> </target> <target name="doxygen" description="Process documentation" > <exec executable="${doxygen.cmd}" dir="${build.native}" failonerror="false"> <arg value="Doxygen.cfg"/> </exec> </target> ... ... - Configure dOxygen:
DOxygen is typically installed on Linux systems during the initial install, with yum, by RPM or apt-get. This is detailed in the YoLinux Systems Administration tutorial.The generation of the dOxygen configuration file and settings are detailed in the YoLinux dOxygen and C++ tutorial.
The Jenkins dOxygen plugin uses the dOxygen config file to locate the generated dOxygen documentation.
[Potential Pitfall]: The dOxygen configuration file uses the directive "OUTPUT_DIRECTORY" to locate the output for the generated documentation. This may not have the correct directory prefix to match the Subversion base directory as viewed from Jenkins. Thus it may be necessary to create a new dOxygen configuration file to fool Jenkins into looking in the proper directory.
Example: original dOxygen configuration file may reference the path as follows:
File: Doxygen.cfgIn order for Jenkins the find the documentation files, generate a new dOxygen configuration will with the correct relative path:... ... OUTPUT_DIRECTORY = Docs ... ...
File: JenkinsDoxyfile.cfgThis file only used to trick Jenkins into looking at the correct location and is not a proper dOxygen configuration file for generating documentation.# File to trick Jenkins dOxygen plugin to find HTML reports location PROJECT_NAME = ProjectX OUTPUT_DIRECTORY = ProjectX/Docs OUTPUT_LANGUAGE = English GENERATE_HTML = YES HTML_OUTPUT = html
Jenkins will now look in ProjectX/Docs/html/ for the files.
- Jenkins Project Configuration:
- Select your build job from the Jenkins home page dashboard.
- Select "Configure" (top left hand side of page)
- At the bottom of page under "Post-build Actions" select the "Publish Doxygen" box.
- Set Doxygen config file:
Doxygen path: ProjectX/Doxyfile.cfg
Note that this is the configuration file used by dOxygen to generate the report. - Select the "Save" button to save this configuration.
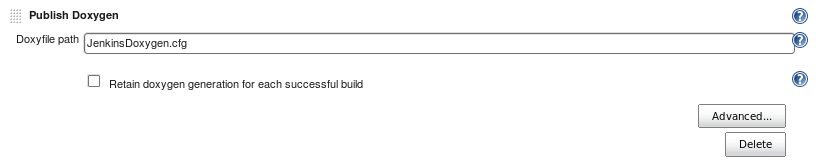
The dOxygen plugin will request the name of the dOxygen configuration file from which it will determine the path to the generated documents. - Jenkins Display:

The dOxygen plugin will generate the link shown
[Potential Pitfall]: Jenkins version 1.4xx requires Java 1.5 or newer. If running on a Solaris 8 platform you will be limited to Java 1.5 as your latest version. Note that some plugins are compiled with later versions of Java and may cause unexpected errors.
FATAL: java.lang.String.isEmpty()Z
   java.lang.NoSuchMethodError: java.lang.String.isEmpty()Z
   at jenkins.plugins.doxygen.DoxygenDirecotryParser.getDoxygenGeneratedDir(DoxygenDirectoryParser.java:126)
In this error, the Doxygen plugin makes a call to isEmpty() which is a method available with Java 1.6 but not 1.5.
An alternative solution is to use the "sidebar link" to point to the location of the generated documents:
/job/project-name/ws/doc-path/html/index.html
CppCheck is used to find bad coding practices or potentially unintended behavior in C++ code.
- Install CppCheck:
- Home page: http://cppcheck.sourceforge.net/
- Install:
- Red Hat: RPMs available from the EPEL repository.
Requires the cppcheck and tinyxml2 RPM packages. - Ubuntu: sudo apt-get install cppcheck
- Red Hat: RPMs available from the EPEL repository.
- Install Jenkins CppCheck Plugin:
- Select from the Jenkins (start page) + "Manage Jenkins" + "Manage Plugins". Now select the "Available" tab and select the CppCheck Plugin.
- Select the "Install and Restart Jenkins" button.
- CppCheck Plugin Info
- Ant build:
Add the following to your Ant build.xml file:
Note:<property name="build.native" value="./src"/> <property name="cppcheck.cmd" value="/usr/bin/cppcheck"/> ... ... <target name="cppcheck" description="C++ code check" > <exec dir="${build.native}" executable="${cppcheck.cmd}" failonerror="true"> <arg line="--xml --xml-version=2 --enable=all --inconclusive --language=c++ *.cpp"/> <redirector error="cppcheck.xml"/> </exec> </target>- Use CppCheck command line argument "--xml" to write results in XML to error stream. The ant redirector outputs this to a file.
- CppCheck man page
- A recursive directory scan can be used by specifying a directory instead of files. In the above example set build.native to "." and instead of specifying file targets (*.cpp), specify a directory (src). This will cause Cppcheck to recursively scan the directory "src" for files to check.
- Jenkins Configuration:
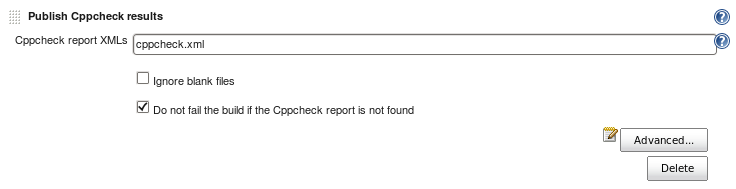
Enter the CppCheck "outputFile" which the plug-in will read to display results. - Results:
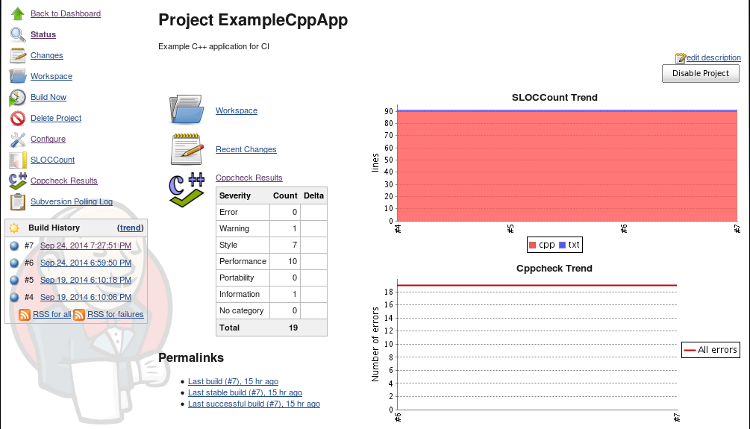
Select the "CppCheck Trend" chart to view the details:
This plugin reports the number of Gnu C++ compiler warnings and errors over time. Other compilers are also supported. This plugin can be used to generate a plot. No extra software is required as it just reports extra information about your C++ build.
- Install Jenkins Warnings Plugin:
- Select from the Jenkins (start page) + "Manage Jenkins" + "Manage Plugins". Now select the "Available" tab and select the Compiler Warnings Plugin.
- Select the "Install and Restart Jenkins" button.
- Warnings Plugin Info (scans console logs for warnings)
- Jenkins Configuration:
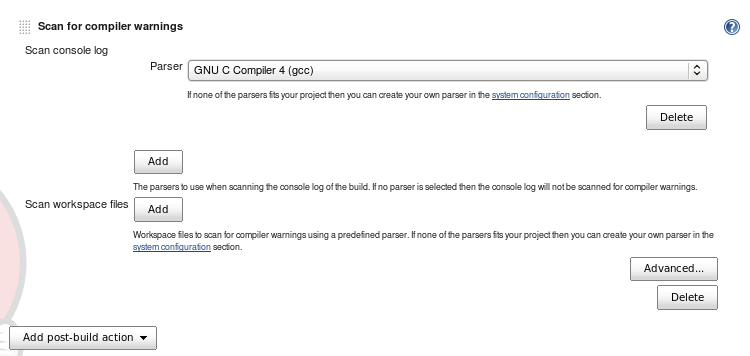
Specify your compiler (in this case GNU C) - Results:
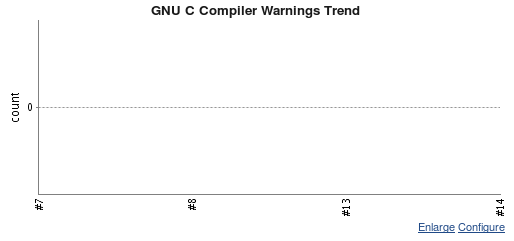
Plot of the number of compiler warnings (in this case none)
Java's JUnit is supported natively by Jenkins, so for one to display C++ unit test results, the C++ unit test must output a compatible XML format. Google Test is preferred as it can output JUnit compatible XML. CppUnit outputs an XML result to which you must apply an XSLT XML translation to allow it to be viewed by the JUnit plugin.
See the YoLinux tutorials:
Jenkins Project Configuration:
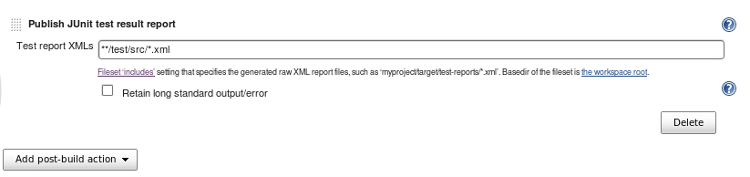
Jenkins unit test reporting:
Gcov is the GNU code coverage facility used to obtain results from a run of an instrumented GNU C++ compiled application. We will use "gcovr", a Python script which runs "gcov" and formats output into an XML format compatible with the Java code coverage tool Cobertura for display by Jenkins by the Cobertura plugin. GCovr is available courtesy of the developers at Sandia National Labs.
- Install "gcovr":
- GCovr Home Page
- Download: gcovr-3.2.tar.gz
- Install Prerequisites:
- Requires Python Pip for installation:
- Source: https://pip.pypa.io/en/latest/
- Red Hat:
- EPEL RPM: python-pip-1.3.1-4.el6.noarch.rpm
- Yum: sudo yum install python-pip
- Ubuntu: sudo apt-get install python-pip
- Requires Python Pip for installation:
- Install GCovr: pip install gcovr-3.2.tar.gz
(This works for me)[Potential Pitfall]: Note that the install recommended by the GCovr website is "pip install gcovr" which would download and install the package. I got the following error:
[prompt]$ pip install gcovr
Downloading/unpacking gcovr
  Cannot fetch index base URL https://pypi.python.org/simple/
  Could not find any downloads that satisfy the requirement gcovr
No distributions at all found for gcovr
- Install Cobertura plugin:
- Select from the Jenkins (start page) + "Manage Jenkins" + "Manage Plugins". Now select the "Available" tab and select the Cobertura Plugin.
- Select the "Install and Restart Jenkins" button.
- Cobertura Plugin info
- Configure Build:
- C++ code must be compiled with the following flags to generate the appropriate binary data files when the application is run.
Compile: g++ -fprofile-arcs -ftest-coverage -fPIC -O0 example1.cpp -o example1 - Run application: ./example1 (This will generate output binary data files)
- Ant configuration: build.xml
(Run gcovr to generate XML for Cobertura and HTML coverage reports)
Equivalent to the commands:... ... <property name="build.native" value="./src"/> <property name="build.test" value="./test/src"/> <property name="gcovr.cmd" value="/usr/bin/gcovr"/> ... ... <target name="run" description="Run application and generate gmon.out" depends="compile"> <exec dir="${build.native}" executable="exampleapp" failonerror="true"> </exec> </target> <target name="run-test" description="Run application" depends="compile-test"> <exec dir="${build.test}" executable="testAll" failonerror="true"> <arg line="--gtest_output="xml:./testAll.xml""/> </exec> </target> <target name="gcovr-xml" description="Run gcovr and generate coverage output" depends="run,run-test"> <exec dir="${build.native}" executable="${gcovr.cmd}" failonerror="true"> <arg line="--branches --xml-pretty -r ."/> <redirector output="gcovr.xml"/> </exec> </target> <target gcovr-html" description="Run gcovr and generate coverage output" depends="run,run-test"> <exec dir="${build.native}" executable="${gcovr.cmd}" failonerror="true"> <arg line="--branches -r . --html --html-details -o gcovr-report.html"/> </exec> </target> ... ...- gcovr --branches --xml-pretty -r .
- gcovr --branches -r . --html --html-details -o gcovr-report.html
- C++ code must be compiled with the following flags to generate the appropriate binary data files when the application is run.
- Jenkins Plugin Configuration:
or use the advanced configuration panel: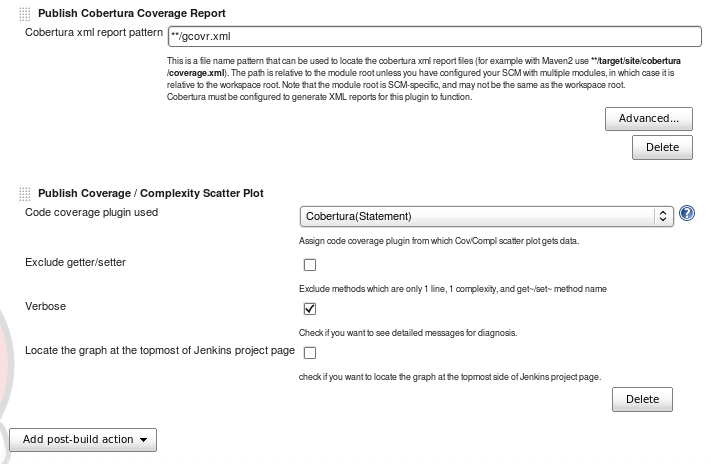
Specify location of XML report. Code coverage limits can be set to determine if the build is considered a pass or fail. Set to zero if code coverage will not be used to determine if the build is a pass or fail.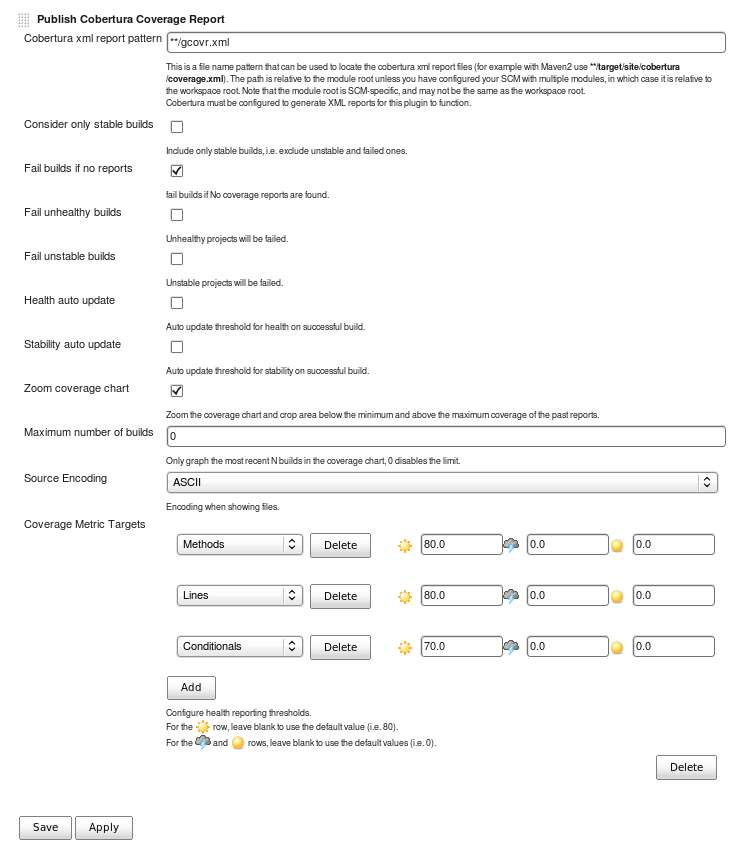
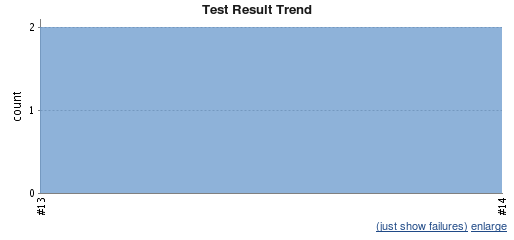
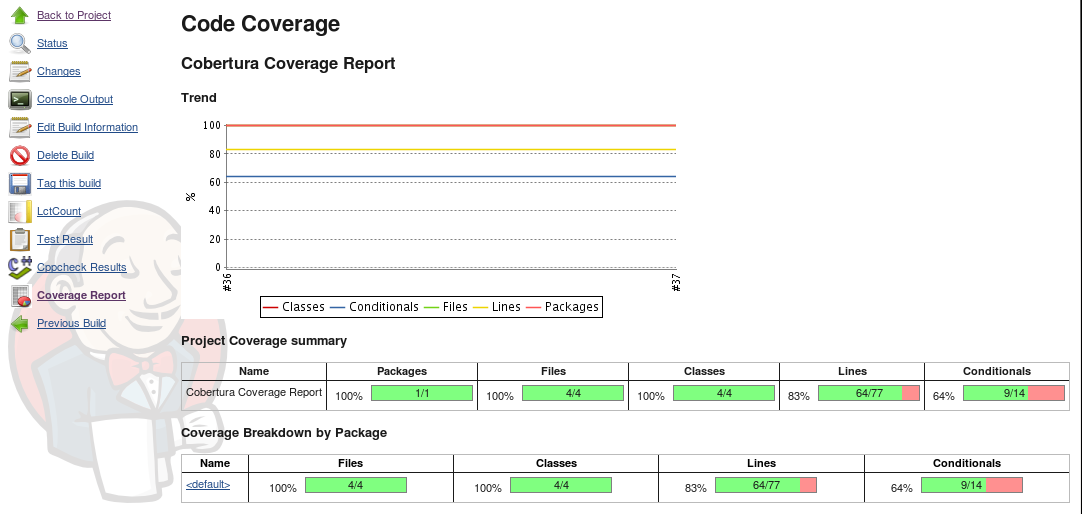
Select the "Save" button to save this configuration. - Coverage Display:
Select graph plot to view details.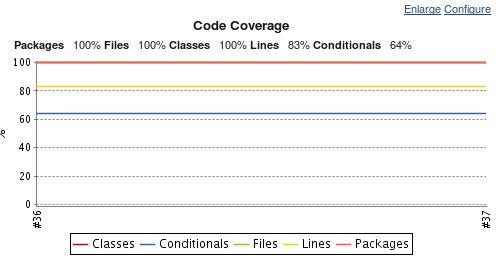

- GCovr HTML Report: I use the "Sidebar Link" Jenkins plugin to point to the URL of the HTML report:
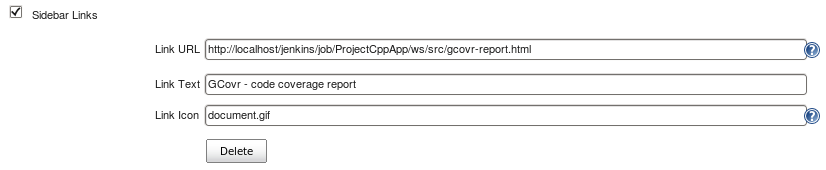
Links:
The GNU gprof facility can provide a profiling report of your code execution to state how much time was spent in each function (if greater than or equal to 0.01 seconds). There is no special plugin or formatting tool. The GNU profiling report will be viewable using the Jenkins Sidebar link plugin.
- Configure Build:
- C++ code must be compiled with the following flags to generate the appropriate binary data files when the application is run.
Compile: g++ -pg -O0 exampleapp.cpp -o exampleapp - Run application: ./exampleapp (This will generate output binary data file: gmon.out)
- Run the GNU gprof tool on the binary data file to obtain the text file report.
- Ant configuration: build.xml
Equivalent to the commands:
... ... <property name="build.native" value="./src"/> <property name="build.test" value="./test/src"/> <property name="gprof.cmd" value="/usr/bin/gprof"/> ... ... <target name="run" description="Run application and generate gmon.out" depends="compile"> <exec dir="${build.native}" executable="exampleapp" failonerror="true"> </exec> </target> <target name="run-test" description="Run application" depends="compile-test"> <exec dir="${build.test}" executable="testAll" failonerror="true"> </exec> </target> <target name="gprof" description="Run gprof and generate profile output" depends="run,run-test"> <exec dir="${build.native}" executable="${gprof.cmd}" failonerror="true"> <arg value="exampleapp"/> <arg value="gmon.out"/> <redirector output="gprof_output.txt"/> </exec> </target> ... ...- g++ -pg -O0 exampleapp.cpp -o exampleapp
- ./exampleapp
- gprof exampleapp gmon.out > gprof_output.txt
- C++ code must be compiled with the following flags to generate the appropriate binary data files when the application is run.
- Gprof Report: I use the "Sidebar Link" Jenkins plugin to point to the URL of the text file report:
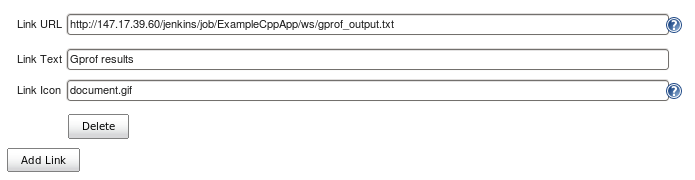
Links:
- Jenkins home page
- Apache Ant home page
- Download: download
- Apache Ant manual
- g++ man page
- gcc man page
 Books:
 |
Continuous Integration: Improving Software Quality and Reducing Risk
(Paperback) by Steve Matyas, Andrew Glover Addison-Wesley Professional
|

|
 |
Jenkins: The Definitive Guide
(Paperback) by John Ferguson Smart O'Reilly Media (July 27, 2011) Java development focus. |
|
 |
Better Software Magazine
Free subscription for software professionals who care about quality. Each issue brings you relevant, timely information to help you build better software. Continuing to deliver in-depth articles on testing, tools, defect tracking, metrics, and management. |
Free Subscription |