
Starting GDB:
- gdb name-of-executable
- gdb -e name-of-executable -c name-of-core-file
- gdb name-of-executable --pid=process-id
Use ps -auxw to list process id's:Attach to a process already running:
[prompt]$ ps -auxw | grep myapp
user1     2812  0.7  2.0 1009328 164768 ?      Sl   Jun07   1:18 /opt/bin/myapp
[prompt]$ gdb /opt/bin/myapp 2812
OR
[prompt]$ gdb /opt/bin/myapp --pid=2812
Command line options: (version 6. Older versions use a single "-")
| Option | Description |
|---|---|
| --help -h |
List command line arguments |
| --exec=file-name -e file-name |
Identify executable associated with core file. |
| --core=name-of-core-file -c name-of-core-file |
Specify core file. |
| --command=command-file -x command-file |
File listing GDB commands to perform. Good for automating set-up. |
| --directory=directory -d directory |
Add directory to the path to search for source files. |
| --cd=directory | Run GDB using specified directory as the current working directory. |
| --nx -n |
Do not execute commands from ~/.gdbinit initialization file. Default is to look at this file and execute the list of commands. |
| --batch -x command-file | Run in batch (not interactive) mode. Execute commands from file. Requires -x option. |
| --symbols=file-name -s file-name |
Read symbol table from file file. |
| --se=file-name | Use FILE as symbol file and executable file. |
| --write | Enable writing into executable and core files. |
| --quiet -q |
Do not print the introductory and copyright messages. |
| --tty=device | Specify device for running program's standard input and output. |
| --tui | Use a terminal user interface. Console curses based GUI interface for GDB. Generates a source and debug console area. |
| --pid=process-id -p process-id |
Specify process ID number to attach to. |
| --version | Print version information and then exit. |
Commands used within GDB:
| Command | Description |
|---|---|
| help | List gdb command topics. |
| help topic-classes | List gdb command within class. |
| help command | Command description. eg help show to list the show commands |
| apropos search-word | Search for commands and command topics containing search-word. |
| info args i args |
List program command line arguments |
| info breakpoints | List breakpoints |
| info break | List breakpoint numbers. |
| info break breakpoint-number | List info about specific breakpoint. |
| info watchpoints | List breakpoints |
| info registers | List registers in use |
| info threads | List threads in use |
| info set | List set-able option |
| Break and Watch | |
| break funtion-name break line-number break ClassName::functionName |
Suspend program at specified function of line number. |
| break +offset break -offset |
Set a breakpoint specified number of lines forward or back from the position at which execution stopped. |
| break filename:function | Don't specify path, just the file name and function name. |
| break filename:line-number | Don't specify path, just the file name and line number. break Directory/Path/filename.cpp:62 |
| break *address | Suspend processing at an instruction address. Used when you do not have source. |
| break line-number if condition | Where condition is an expression. i.e. x > 5 Suspend when boolean expression is true. |
| break line thread thread-number | Break in thread at specified line number. Use info threads to display thread numbers. |
| tbreak | Temporary break. Break once only. Break is then removed. See "break" above for options. |
| watch condition | Suspend processing when condition is met. i.e. x > 5 |
| clear clear function clear line-number |
Delete breakpoints as identified by command option. Delete all breakpoints in function Delete breakpoints at a given line |
| delete d |
Delete all breakpoints, watchpoints, or catchpoints. |
| delete breakpoint-number delete range |
Delete the breakpoints, watchpoints, or catchpoints of the breakpoint ranges specified as arguments. |
| disable breakpoint-number-or-range enable breakpoint-number-or-range |
Does not delete breakpoints. Just enables/disables them. Example: Show breakpoints: info break Disable: disable 2-9 |
| enable breakpoint-number once | Enables once |
| continue c |
Continue executing until next break point/watchpoint. |
| continue number | Continue but ignore current breakpoint number times. Usefull for breakpoints within a loop. |
| finish | Continue to end of function. |
| Line Execution | |
| step s step number-of-steps-to-perform |
Step to next line of code. Will step into a function. |
| next n next number |
Execute next line of code. Will not enter functions. |
| until until line-number |
Continue processing until you reach a specified line number. Also: function name, address, filename:function or filename:line-number. |
| info signals info handle handle SIGNAL-NAME option |
Perform the following option when signal recieved: nostop, stop, print, noprint, pass/noignore or nopass/ignore |
| where | Shows current line number and which function you are in. |
| Stack | |
| backtrace bt bt inner-function-nesting-depth bt -outer-function-nesting-depth |
Show trace of where you are currently. Which functions you are in. Prints stack backtrace. |
| backtrace full | Print values of local variables. |
| frame frame number f number |
Show current stack frame (function where you are stopped) Select frame number. (can also user up/down to navigate frames) |
| up down up number down number |
Move up a single frame (element in the call stack) Move down a single frame Move up/down the specified number of frames in the stack. |
| info frame | List address, language, address of arguments/local variables and which registers were saved in frame. |
| info args info locals info catch |
Info arguments of selected frame, local variables and exception handlers. |
| Source Code | |
|
list l list line-number list function list - list start#,end# list filename:function |
List source code. |
| set listsize count show listsize |
Number of lines listed when list command given. |
| directory directory-name dir directory-name show directories |
Add specified directory to front of source code path. |
| directory | Clear sourcepath when nothing specified. |
| Machine Language | |
| info line info line number |
Displays the start and end position in object code for the current line in source. Display position in object code for a specified line in source. |
| disassemble 0xstart 0xend | Displays machine code for positions in object code specified (can use start and end hex memory values given by the info line command. |
| stepi si nexti ni |
step/next assembly/processor instruction. |
| x 0xaddress x/nfu 0xaddress |
Examine the contents of memory. Examine the contents of memory and specify formatting.
|
| Examine Variables | |
| print variable-name p variable-name p file-name::variable-name p 'file-name'::variable-name |
Print value stored in variable. |
| p *array-variable@length | Print first # values of array specified by length. Good for pointers to dynamicaly allocated memory. |
| p/x variable | Print as integer variable in hex. |
| p/d variable | Print variable as a signed integer. |
| p/u variable | Print variable as a un-signed integer. |
| p/o variable | Print variable as a octal. |
| p/t variable x/b address x/b &variable |
Print as integer value in binary. (1 byte/8bits) |
| p/c variable | Print integer as character. |
| p/f variable | Print variable as floating point number. |
| p/a variable | Print as a hex address. |
| x/w address x/4b &variable |
Print binary representation of 4 bytes (1 32 bit word) of memory pointed to by address. |
| ptype variable ptype data-type |
Prints type definition of the variable or declared variable type. Helpful for viewing class or struct definitions while debugging. |
| GDB Modes | |
| set gdb-option value | Set a GDB option |
| set logging on set logging off show logging set logging file log-file |
Turn on/off logging. Default name of file is gdb.txt |
| set print array on set print array off show print array |
Default is off. Convient readable format for arrays turned on/off. |
| set print array-indexes on set print array-indexes off show print array-indexes |
Default off. Print index of array elements. |
| set print pretty on set print pretty off show print pretty |
Format printing of C structures. |
| set print union on set print union off show print union |
Default is on. Print C unions. |
| set print demangle on set print demangle off show print demangle |
Default on. Controls printing of C++ names. |
| Start and Stop | |
|
run r run command-line-arguments run < infile > outfile |
Start program execution from the beginning of the program. The command break main will get you started. Also allows basic I/O redirection. |
| continue c |
Continue execution to next break point. |
| kill | Stop program execution. |
| quit q |
Exit GDB debugger. |
- Compile with the "-g" option (for most GNU and Intel compilers) which generates added information in the object code so the debugger can match a line of source code with the step of execution.
- Do not use compiler optimization directive such as "-O" or "-O2" which rearrange computing operations to gain speed as this reordering will not match the order of execution in the source code and it may be impossible to follow.
- control+c: Stop execution. It can stop program anywhere, in your source or a C library or anywhere.
- To execute a shell command: ! command
or shell command - GDB command completion: Use TAB key
info bre + TAB will complete the command resulting in info breakpoints
Press TAB twice to see all available options if more than one option is available or type "M-?" + RETURN. - GDB command abreviation:
info bre + RETURN will work as bre is a valid abreviation for breakpoints
Displaying STL container classes using the GDB "p variable-name"
results in an cryptic display of template definitions and pointers.
Use the following ~/.gdbinit file (V1.03 09/15/08). Now works with GDB 4.3+.
(Archived versions: [V1.01 GDB 6.4+ only])
Thanks to Dr. Eng. Dan C. Marinescu for permission to post this script.
Use the following commands provided by the script:
| Data type | GDB command |
|---|---|
| std::vector<T> | pvector stl_variable |
| std::list<T> | plist stl_variable T |
| std::map<T,T> | pmap stl_variable |
| std::multimap<T,T> | pmap stl_variable |
| std::set<T> | pset stl_variable T |
| std::multiset<T> | pset stl_variable |
| std::deque<T> | pdequeue stl_variable |
| std::stack<T> | pstack stl_variable |
| std::queue<T> | pqueue stl_variable |
| std::priority_queue<T> | ppqueue stl_variable |
| std::bitset<n>td> | pbitset stl_variable |
| std::string | pstring stl_variable |
| std::widestring | pwstring stl_variable |
Also see the YoLinux.com STL string class tutorial and debugging with GDB.
Example: STL_vector_int.cpp
#include <iostream>
#include <vector>
#include <string>

using namespace std;

main()
{
   vector<int> II;

   II.push_back(10);
   II.push_back(20);
   II.push_back(30);

   cout << II.size() << endl;

}
Debug in GDB: gdb a.out
(gdb) l
1       #include <iostream>
2       #include <vector>
3       #include <string>
4
5       using namespace std;
6
7       main()
8       {
9          vector<int> II;
10
(gdb) l
11         II.push_back(10);
12         II.push_back(20);
13         II.push_back(30);
14
15         cout << II.size() << endl;
16
17      }
(gdb) break 15
Breakpoint 1 at 0x8048848: file STL_vector_int.cpp, line 15.
(gdb) r
Starting program: /home/userx/a.out

Breakpoint 1, main () at STL_vector_int.cpp:15
15         cout << II.size() << endl;
(gdb) p II
$1 = {
  <std::_Vector_base<int,std::allocator<int> >> = {
    _M_impl = {
      <std::allocator<int>> = {
        <__gnu_cxx::new_allocator<int>> = {<No data fields>}, <No data fields>},
      members of std::_Vector_base<int,std::allocator<int> >::_Vector_impl:
      _M_start = 0x804b028,
      _M_finish = 0x804b034,
      _M_end_of_storage = 0x804b038
    }
  }, <No data fields>}
(gdb) pvector II
elem[0]: $2 = 10
elem[1]: $3 = 20
elem[2]: $4 = 30
Vector size = 3
Vector capacity = 4
Element type = int *
(gdb) c
Continuing.
3

Program exited normally.
(gdb) quit
Notice the native GDB print "p" results in an cryptic display while the "pvector"
routine from the GDB script provided a human decipherable display of your data.
Example: STL_vector_int_2.cpp
#include <iostream>
#include <vector>

using namespace std;

main()
{
   vector< vector<int> > vI2Matrix(3, vector<int>(2,0));

   vI2Matrix[0][0] = 0;
   vI2Matrix[0][1] = 1;
   vI2Matrix[1][0] = 10;
   vI2Matrix[1][1] = 11;
   vI2Matrix[2][0] = 20;
   vI2Matrix[2][1] = 21;

   cout << "Loop by index:" << endl;

   int ii, jj;
   for(ii=0; ii < 3; ii++)
   {
      for(jj=0; jj < 2; jj++)
      {
         cout << vI2Matrix[ii][jj] << endl;
      }
   }
}
Debug in GDB: gdb a.out
(gdb) l
1       #include <iostream>
2       #include <vector>
3
4       using namespace std;
5
6       main()
7       {
8          vector< vector<int> > vI2Matrix(3, vector<int>(2,0));
9
10         vI2Matrix[0][0] = 0;
(gdb) l
11         vI2Matrix[0][1] = 1;
12         vI2Matrix[1][0] = 10;
13         vI2Matrix[1][1] = 11;
14         vI2Matrix[2][0] = 20;
15         vI2Matrix[2][1] = 21;
16
17         cout << "Loop by index:" << endl;
18
19         int ii, jj;
20         for(ii=0; ii < 3; ii++)
(gdb) break 17
Breakpoint 1 at 0x8048a19: file STL_vector_2.cpp, line 17.
(gdb) r
Starting program: /home/userx/a.out

Breakpoint 1, main () at STL_vector_2.cpp:17
17         cout << "Loop by index:" << endl;
(gdb) pvector vI2Matrix
elem[0]: $1 = {
  <std::_Vector_base<int,std::allocator<int> >> = {
    _M_impl = {
      <std::allocator<int>> = {
        <__gnu_cxx::new_allocator<int>> = {<No data fields>}, <No data fields>},
      members of std::_Vector_base<int,std::allocator<int> >::_Vector_impl:
      _M_start = 0x804b040,
      _M_finish = 0x804b048,
      _M_end_of_storage = 0x804b048
    }
  }, <No data fields>}
elem[1]: $2 = {
  <std::_Vector_base<int,std::allocator<int> >> = {
    _M_impl = {
      <std::allocator<int>> = {
        <__gnu_cxx::new_allocator<int>> = {<No data fields>}, <No data fields>},
      members of std::_Vector_base<int,std::allocator<int> >::_Vector_impl:
      _M_start = 0x804b050,
      _M_finish = 0x804b058,
      _M_end_of_storage = 0x804b058
    }
  }, <No data fields>}
elem[2]: $3 = {
  <std::_Vector_base<int,std::allocator<int> >> = {
    _M_impl = {
      <std::allocator<int>> = {
        <__gnu_cxx::new_allocator<int>> = {<No data fields>}, <No data fields>},
      members of std::_Vector_base<int,std::allocator<int> >::_Vector_impl:
      _M_start = 0x804b060,
      _M_finish = 0x804b068,
      _M_end_of_storage = 0x804b068
---Type <return> to continue, or q <return> to quit---
    }
  }, <No data fields>}
Vector size = 3
Vector capacity = 3
Element type = class std::vector<int,std::allocator<int> > *
(gdb) pvector $1
elem[0]: $4 = 0
elem[1]: $5 = 1
Vector size = 2
Vector capacity = 2
Element type = int *
(gdb) pvector $2
elem[0]: $6 = 10
elem[1]: $7 = 11
Vector size = 2
Vector capacity = 2
Element type = int *
(gdb) pvector $3
elem[0]: $8 = 20
elem[1]: $9 = 21
Vector size = 2
Vector capacity = 2
Element type = int *
(gdb) p vI2Matrix
$10 = {
  <std::_Vector_base<std::vector<int, std::allocator<int> >,std::allocator<std::vector<int, std::allocator<int> > > >> = {
    _M_impl = {
      <std::allocator<std::vector<int, std::allocator<int> > >> = {
        <__gnu_cxx::new_allocator<std::vector<int, std::allocator<int> > >> = {<No data fields>}, <No data fields>},
      members of std::_Vector_base<std::vector<int, std::allocator<int> >,std::allocator<std::vector<int, std::allocator<int> > > >::_Vector_impl:
      _M_start = 0x804b018,
      _M_finish = 0x804b03c,
      _M_end_of_storage = 0x804b03c
    }
  }, <No data fields>}
(gdb) quit
Note "pvector" does not de-reference the entire vector of vectors all at once but returns vectors $1, $2 and $3. The "pvector" command then helps us traverse the information by examining the contents of each element in the individual "terminal" vectors.
Note that the native gdb "p vI2Matrix" (last command) was much less informative.
GDB has a console GUI option available with the command line option --tui
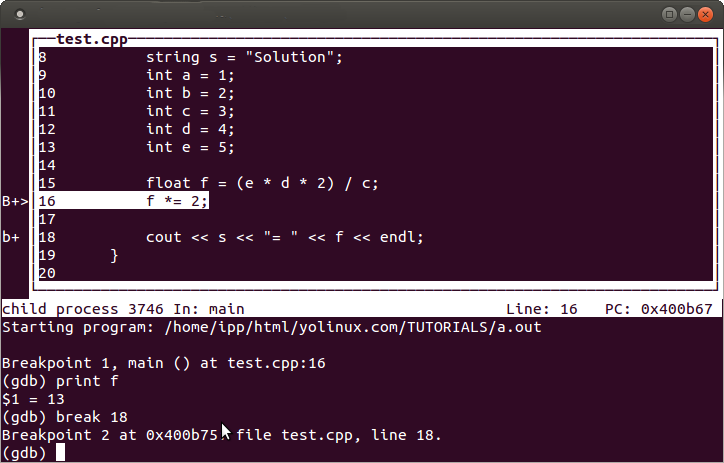
Command just like regular GDB with a source screen showing source code and break points.
My favorite gdb GUI is ddd.
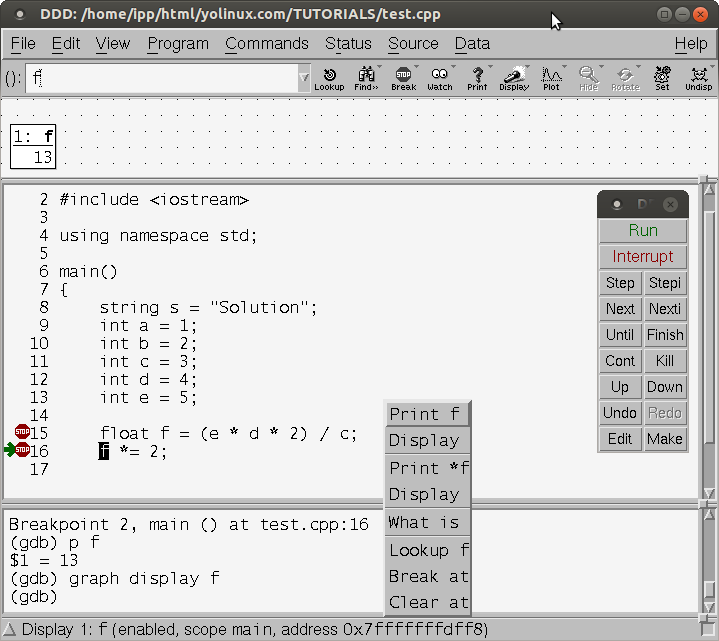
Awesome variable and memory interrogation. Can interactively follow a linked list by clicking on its pointer in the display graph window.
Highlight variable and right click for menu to interrogate variables in source.
Source code line numbers: Source + Display Line Numbers.
Set break points by right clicking just left of the line number.
Installation:
- Ubuntu installation: apt-get install ddd
- Red Hat/Fedora/CentOS RPMs available from EPEL (Extra Packages for Enterprise Linux)
GNU ddd: GUI for gdb, dbx, bashdb, pydb, etc
 Books:
 |
"Debugging with GDB: The GNU Source-Level Debugger"
by Richard Stallman, Roland H. Pesch, Stan Shebs ISBN # 1882114884, Free Software Foundation; 9th edition (January 1, 2002)
|

|
 |
"GDB Pocket Reference"
by Arnold Robbins ISBN # 0596100272, O'Reilly
|
|
 |
"Advanced Linux Programming"
by Mark Mitchell, Jeffrey Oldham, Alex Samuel, Jeffery Oldham ISBN # 0735710430, New Riders Good book for programmers who already know how to program and just need to know the Linux specifics. Covers a variety of Linux tools, libraries, API's and techniques. If you don't know how to program, start with a book on C. |
|